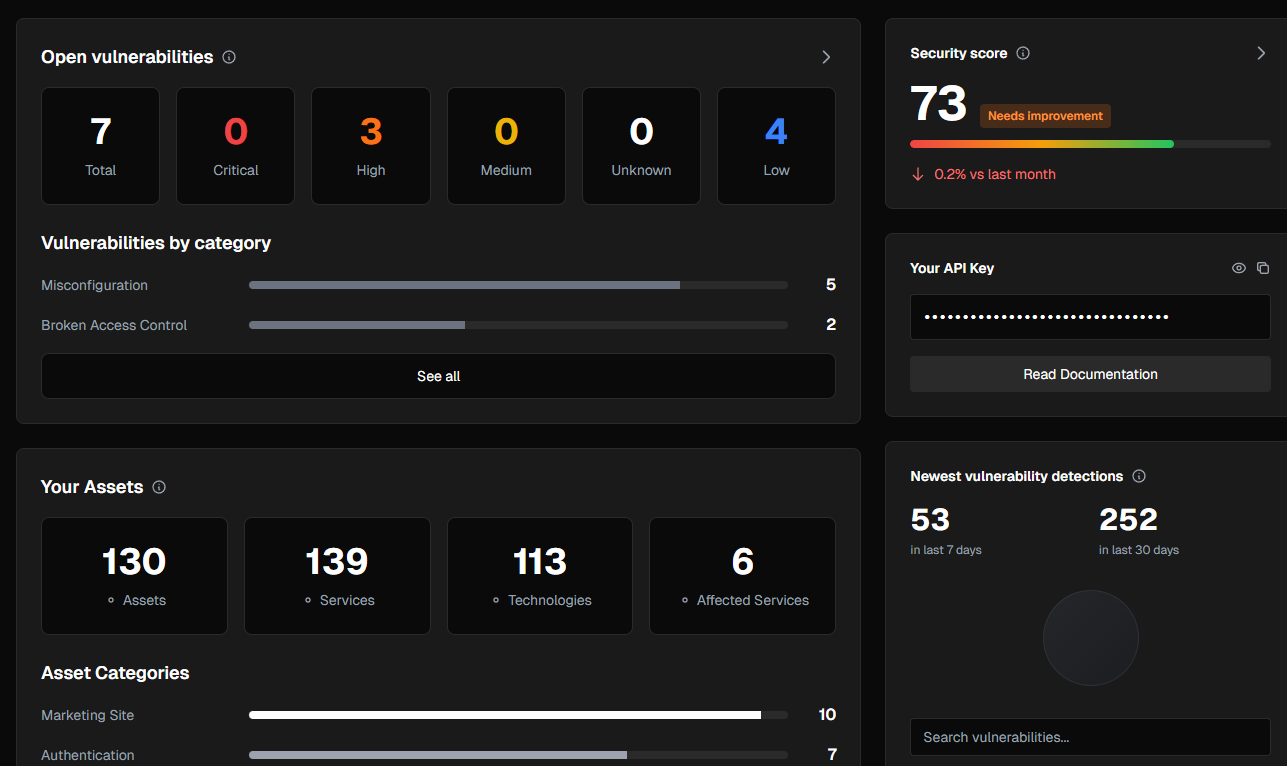
The exposure graph is the backbone of HaxUnit. It tracks assets, services, configurations, and observations over time so we can reason about risk and route work to owners. This post covers the design goals, schema, and the tradeoffs we made along the way.
Goals
- Time-aware — understand not just state, but how it changed.
- Composable — model assets and services independently, then connect them.
- Queryable at scale — power graph traversals and summarizations quickly.
- Stable identifiers — avoid churn when attributes change (IP, hosting, etc.).
Schema
We keep a small set of node types and expressive edges:
- Nodes:
Asset(domain, IP, hostname),Service(port, proto, banner),Software(fingerprint),Finding(exposure or misconfig),Owner(team, repo). - Edges:
hosts,exposes,runs,owned_by,observed_at.
// simplified types
Asset(id, kind, name)
Service(id, asset_id, port, proto, attributes)
Software(id, vendor, product, version, fingerprint)
Finding(id, service_id, rule, severity, evidence)
Owner(id, type, name)
// edges: asset -exposes-> service; service -runs-> software; service -has-> finding; asset/service -owned_by-> owner
Ingestion pipeline
Data arrives as observations. We normalize and enrich before upserting into the graph. Each write creates a new version with validity windows for time travel queries.
observe()
  .normalize_keys()
  .fingerprint()
  .attribute_merge()
  .upsert_nodes_and_edges()
  .emit_change_events()
Query patterns
- Blast radius: given a software CVE, find exposed services and internet-facing assets.
- Ownership: find the team and repos responsible for an exposed endpoint.
- Drift: diff exposure between two points in time.
Scaling notes
We batch upserts by logical entity, separate hot (recent) from cold (historical) storage, and denormalize computed views for the UI. The result is fast list views and accurate time-based investigations.
If you want a deeper dive or have feedback on the model, reach out — we’re happy to chat.

